There are multiple possible causes for TSSA Jobs to remain in the Waiting to Run state when launched manually and/or when executed via a Job Schedule.
When troubleshooting this issue, the following should be checked in this order:
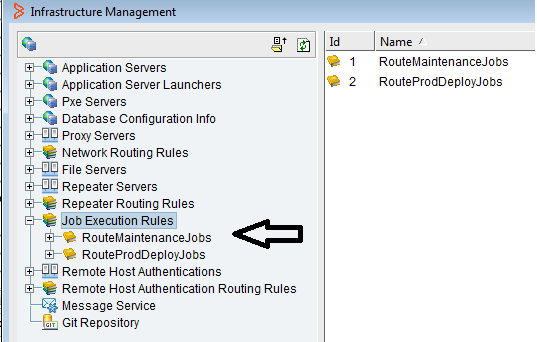
1) Job Execution Rules
Check whether there are any Job Execution Rules defined in this environment. This is especially important to check when it seems that the problem is only affecting a subset of jobs e.g. jobs of a certain type. Its still important to check if all jobs are affected. Job Execution Rules are defined in the TSSA Console under Infrastructure Management - Job Execution Rules
If job Execution Rules are defined:
- Were any of these rules added recently and their addition aligns with the beginning of the "Waiting To Run" issue? If so, check the logic of these rules for a flaw in the logic. For example, no Application Servers are assigned to this rule. Try temporarily deleting the new rule(s) (after noting their logic), waiting a few minutes and then retesting job execution. If this resolves the issue, we can focus on the logic of the new Job Routing rule(s).
- Are the rules being evaluated in the intended order? Right click the "Job Execution Rules" node highlighted above and select Rules Management. Review the rules to make sure their order makes sense.
- Check the status of each of the TSSA Application Servers targeted by the Job Routing Rules and check their status under the Application Servers node of Infrastructure Management . For example, if the first Job Execution rule in a list says "Route all jobs to Appserver A" but Appserver A is down for some reason, then the jobs will sit in the "Waiting To Run" state since it has been told to only use Appserver A but that Appserver is down. If a Job Routing Rule refers to a single Application Server, and that Application Server is down, we need to either modify the rule to use other Application Servers or work on resolving the Application Server down issue.
- On the Leader application server, look for log messages such as and investigate the noted appservers:
[01 Dec 2019 01:00:42,095] [Job-Distribution-Plan-Thread] [WARN] [::] [] Job: Windows Patching cannot be run, execution rules resolve to application servers: [blapp1.example.com,blapp2.example.com,blapp3.example.com], but none of those servers are currently running. This job schedule will expire on Sun Dec 01 02:00:00 EST 2019.
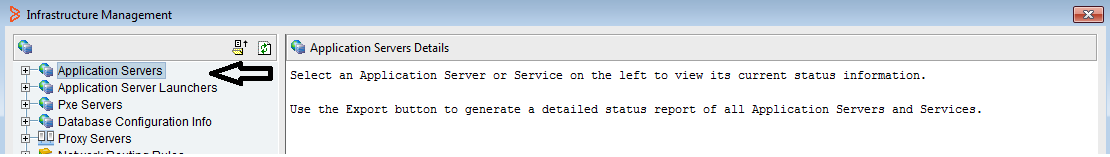
2 Status (Up or Down) of TSSA Application Servers
Check the status of each of the TSSA Application Servers under the "Application Servers" node of Infrastructure Management:
Consider a Multi Appserver TSSA environment which consists of two Configuration Servers and two Job Servers.
If the two Job Servers are currently down but the two Config Servers are up, the user will be able to login to their TSSA Console and kick off jobs but there will be no Job Servers up and running to actually execute these jobs so they will sit in the "Waiting To Run" state.
Check the status of all Application Servers especially those of type JOB or ALL as those are required for job execution to occur.
3) Application Server is currently consuming all WorkItemThreads or has reached MaxJobs limit
A TSSA Application Server of type JOB or ALL has a
MaxWorkItemThreads setting which limits the number of threads available to run TSSA Jobs.
If every TSSA Application Server is currently using all of its WorkItemThreads, then there will be no WorkItemThreads available to execute a newly-executed job until some WorkItemThreads are freed up by other jobs completing of a WorkItem.
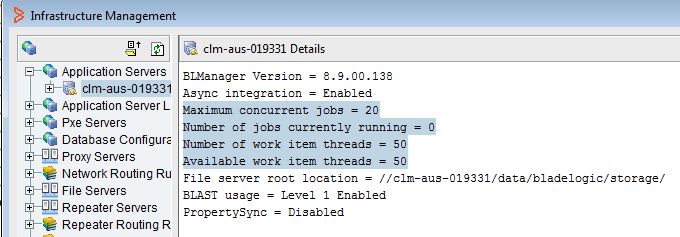
Check the "Available work item threads" value of each TSSA Application Server under Infrastructure Management to confirm that all Application Servers are not currently utilizing 100% of their WorkItemThreads. See highlighted values below:
Alternatively, review the
Memory Monitor line in the appserver logs to see the WIT status:
[26 Feb 2020 19:11:55,830] [Scheduled-System-Tasks-Thread-14] [INFO] [System:System:] [Memory Monitor] Total JVM (B): 361443328,Free JVM (B): 199047952,Used JVM (B): 162395376,VSize (B): 9224421376,RSS (B): 648073216,Used File Descriptors: 301,Used Work Item Threads: 51/100,Used NSH Proxy Threads: 0/15,Used Client Connections: 1/200,DB Client-Connection-Pool: 0/0/0/200/150/50,DB Job-Connection-Pool: 0/0/0/200/150/50,DB General-Connection-Pool: 2/2/0/200/150/50,Host/Appserver/Version: blapp894.example.com/blapp894.example.com/8.9.04.200
There are several reasons why you might run out of WorkItem Threads: Your environment is operating at peak capacity and need additional Job Servers added. This is a momentary spike in resources due to a temporary increase in Job load.
Similarly, check the values of "Maximum concurrent jobs" and "Number of jobs currently running" above to ensure the
MaxJobs limit is also not being reached.
If you are running the maximum number of jobs allowed in the environment and still have available WorkItem Thread capacity, you maybe have several jobs w/ a small number of targets or a single target. Increasing the number of MaxJobs may help make better use of the WorkItem Threads in this case.
4) Application Server and DB Server System Times and Timezones
A common cause of this issue is that the System Time of one of the TSSA Application Servers or the TSSA Database Server is different than the rest of the TSSA Application Servers.
In a Multi Appserver Environment, if the System Time of one of the Application Servers is 2pm but the System Time of the other Application Servers is 1pm then that can cause confusion for the TSSA Job Scheduler. Likewise, if the Timezone of the TSSA Database Server is EST but the Timezone of the TSSA Application Server is PST, this can also cause such problems. Similarly, if the System Time on one of the Application Servers has started to "drift".
Check the System Time and Timezone of each of the TSSA Application Servers and the TSSA Database Server to make sure they are an exact match.
5) Database Performance Issues
If all of the possible causes discussed above have been ruled out, then the issue could be a Database performance problem.
To determine which jobs should be executed and which Application Servers are available to execute them, the TSSA Application Server constantly runs a query called GET_READY_SCHEDULES. If anything happens on the DB Server to cause this query to get stuck or to take longer than expected to complete, this can result in the behavior discussed in this article i.e. TSSA jobs sitting in the Waiting To Run status.
Ask the site DBA to examine the performance of the TSSA DB paying particular attention to:
- What was the BMC-recommended gather schema stats job last run? If it has not been run in the last few days, rerun and retest.
- Ensure the Oracle Out Of Box gather_stats routine has been disabled and replaced with the BMC-recommended gather_stats wrapper as highlighted in the TSSA documentation.
- Are there any long-standing locks which are preventing other queries from completing?
- What is the CPU usage of the TSSA DB?
- If the DB is Oracle 12, ensure that OPTIMIZER_ADAPTIVE_FEATURES is disabled per the TSSA documentation.
6) What to provide when creating a Support Case for this issue:
If none of the above results in the issue being resolved, please provide the following information when creating a case with BMC customer Support:
a) When was the problem first observed in the environment?
b) Any notable environment changes which coincided with the problem first occurring? e.g. DB move, addition of a new Job Routing Rule, addition of new Application Server, TSSA upgrade etc.
c) Are all job affected or just certain jobs or job types?
d) Screenshot of any Job Routing Rules and their definitions.
e) Current Timezone and System Time of each Appserver host and the DB Server host.
f) Appserver Details: Export the "Detail Report" multiple times during the time of the problem, waiting about three minutes between exports. This can be captured by navigating to Configuration - Infrastructure Management and selecting "Export Detail Report" next to the Refresh icon. This will product a text file with the Appserver Thread Dump for every Application Server in the environment and does not need to be repeated for each Application Server. Doing it at an interval allows BMC Support to look for progress in the various thread information displayed in the report.
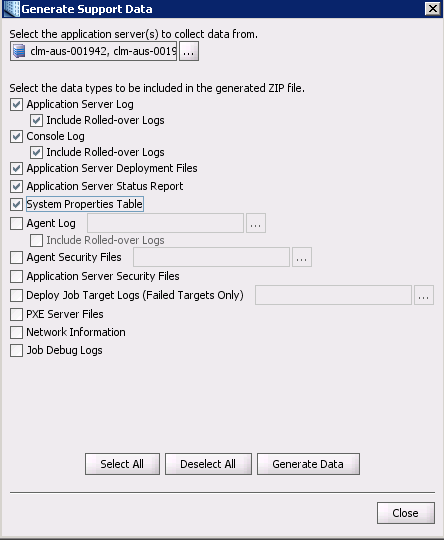
g) Generate Support Data: Run the “Generate Support Data” with the below options checked/selected for each Application Server in the environment. Note that the tool can be run once with all application server selected.This video discusses how to run the “Generate Support Data” utility.
In addition to collecting the Appserver and Console logs (including rolled over log files) selecting the below options will also provide TSSA Customer Support with extensive information about the TSSA environment including:
- Version information
- Number of Application Servers in the TSSA Environment
- OS of Application Servers
- Database Type and Version
- Memory configuration
- Application Servers configuration settings e.g. MaxWorkItemThreads
i) Table Stats Check: Run whichever of the following scripts (both contained in attached BSADBScripts.zip) is appropriate for your DB platform and return the output:
- Oracle: lastAnalyzed_oracle.sql
- SqlServer: lastAnalyzed_sqlserver.sql
j) Database Reports:
- Oracle: Request that the site DBA provide Oracle AWR, ADDM and ASH reports for a time period (e.g one hour) during which the problem was observed. It is important that the reports are captured for a timeframe during which the problems were observed so this will take coordination between the TSSA Admin and the DBA.
- SqlServer: Sql Server usually requires setting up a SQL Server Profiler session and capturing data, so that may require reproducing the problem again when the profiler session is running.
k) Query output: Run the query in the attached
jobs_waiting_to_run.sql multiple times while you have jobs in the waiting to run state, approximately 3 minutes apart. This will let BMC Support determine if job were moving from the
Waiting to run state and actually being run, or the queue of jobs waiting to run was not being reduced.
l) Scheduled job issue: share blas-1.4.0.jar and bladelogic_infra.jar from application server for fix.