|
b) Configuration Apperver Logs - perform the following steps on the BSA/TSSA Application Server which the console is connecting to:
1. Backup the following file: "<TSSA_INSTALL_DIR>/NSH/br/deployments/<deployments>/lob4j.properties
2. Edit the following line:
From: log4j.logger.com.bladelogic.om.infra.app.service.db.DefaultDatabaseServiceImpl=INFO
To: log4j.logger.com.bladelogic.om.infra.app.service.db.DefaultDatabaseServiceImpl=DEBUG
You don’t have to restart the application server. After 30 to 40 seconds it will start logging debug entries.
c) Reproduce the issue and carefully note the timeframe during which the issue was reproduced.Undo the lob4j.properties change from "b" above after reproducing the issue
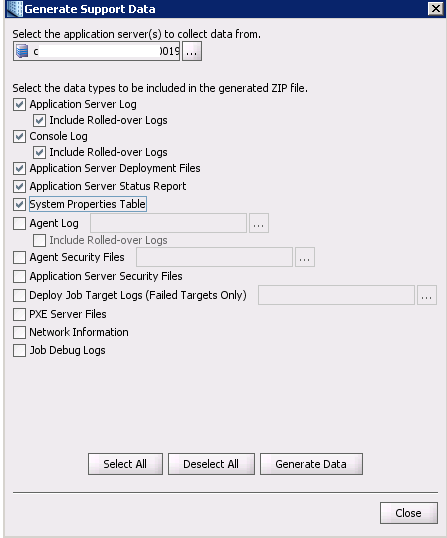
d) Generate Support Data: Run the “Generate Support Data” with the below options checked/selected for each Application Server in the environment. Note that the tool can be run once with all application server selected.This video discusses how to run the “Generate Support Data” utility.
In addition to collecting the Appserver and Console logs (including rolled over log files) selecting the below options will also provide BSA Customer Support with extensive information about the BSA environment including:
- Version information
- Number of Application Servers in the BSA Environment
- OS of Application Servers
- Database Type and Version
- Memory configuration
- Application Servers configuration settings e.g. MaxWorkItemThreads
e) Database Reports - Oracle
AWR, ADDM and ASH report for the hour duringwhich issue was reproduced.
Also, short AWR report for example 10 mins by following below link and steps
- Have the DBA setup to create manual AWR snapshot on BladeLogic database.
- Run the actions that are slow in that GUI, note what actions are slow.
- Create another manual AWR snapshot.
- Send AWR report
f) Database Reports - SQL Server
- Have the DBA setup a trace session on the BladeLogic database.
Run the actions that are slow in that GUI, note what actions are slow, then stop the DB trace and send the trace and the actions/times.
2. Database maintenance job history. Please follow below steps.
a. Go to SQLServer Management Console
b. Login using sysdba user
c. Under Object Explorer, expand to ‘SQL Server Agent’
d. Right click on ‘Jobs’ and click ‘View History’
e. Select all history for last 60 days and export to excel.
3. While the issue is being reproduced please capture the output of these queries. These may need to be run by the DBA as the sys users.
1) sp_who
2) sp_who2
3)
SELECT r.start_time [Start Time],session_ID [SPID],
DB_NAME(database_id) [Database],
SUBSTRING(t.text,(r.statement_start_offset/2)+1,
CASE WHEN statement_end_offset=-1 OR statement_end_offset=0
THEN (DATALENGTH(t.Text)-r.statement_start_offset/2)+1
ELSE (r.statement_end_offset-r.statement_start_offset)/2+1
END) [Executing SQL],
Status,command,wait_type,wait_time,wait_resource,
last_wait_type
FROM sys.dm_exec_requests r
OUTER APPLY sys.dm_exec_sql_text(sql_handle) t
WHERE session_id != @@SPID -- don't show this query
AND session_id > 50 -- don't show system queries
ORDER BY r.start_time;
4)
SELECT TOP 50
SUBSTRING(eqt.TEXT,(
eqs.statement_start_offset/2) +1
,((CASE eqs.statement_end_offset
WHEN -1 THEN DATALENGTH(eqt.TEXT)
ELSE eqs.statement_end_offset
END - eqs.statement_start_offset)/2)+1)
,eqs.execution_count
,eqs.total_logical_reads
,eqs.last_logical_reads
,eqs.total_logical_writes
,eqs.last_logical_writes
,eqs.total_worker_time
,eqs.last_worker_time
,eqs.total_elapsed_time/1000000 AS Total_elapsed_time_Secs
,eqs.last_elapsed_time/1000000 AS Last_elapsed_time_Secs
,eqs.last_execution_time
,eqp.query_plan
FROM sys.dm_exec_query_stats eqs
CROSS APPLY sys.dm_exec_sql_text(eqs.sql_handle) eqt
CROSS APPLY sys.dm_exec_query_plan(eqs.plan_handle) eqp
ORDER BY eqs.total_worker_time DESC;
5)
SELECT TOP 10
[wait_type],
[waiting_tasks_count],
[wait_time_ms]
FROM sys.[dm_os_wait_stats] AS [ws]
ORDER BY [wait_time_ms] DESC;
|